The GEC4 Demo (Part 2)
| Phase | QID | Threshold (#pkts) |
Bandwidth (Mb/s) |
Description |
|---|---|---|---|---|
| 1 | 9 | 1000 | 100 | Base Case |
| |
10 | 1000 | 100 | |
| |
11 | 1000 | 100 | |
| 2 | 9 | 1000 | 100 | Change Thresholds |
| |
10 | 2000 | 100 | |
| |
11 | 3000 | 100 | |
| 3 | 9 | 1000 | 100 | Base Case |
| |
10 | 1000 | 100 | |
| |
11 | 1000 | 100 | |
| 4 | 9 | 1000 | 100 | Change Quantums |
| |
10 | 1000 | 50 | |
| |
11 | 1000 | 25 | |
This part of the demo shows the effects of changing the threshold and bandwidth parameters of packet queues at the bottleneck. The threshold specifies the queue capacity, and the bandwidth specifies the guaranteed bandwidth of the queue. Specifically, the threshold specifies the number of packets that can be queued. Packets arriving to a full queue are discarded. The bandwidth parameter specifies the guaranteed bandwidth in kilobits per sec (Kb/s).
The conduct of the demo involves running the traffic scripts in Part 1 for a longer period of time while another script changeQparams.sh continuously adjusts R1's queue parameters. The procedure is:
- Start the three receivers on onl038, onl039 and onl040 by running the script start_recvs.sh on onl035.
- Start the three traffic generators on onl035, onl036 and onl037 by running the script start_xmits.sh 1200 120000 200 on onl035.
- Run the changeQparams.sh script on R1's GPE.
The arguments to the start_xmits.sh script will send 1200-byte UDP packets at a rate of 120,000 Kb/s (i.e., 120 Mb/s) for 200 seconds. The 200 seconds allows you to start the changeQparams.sh script and observe the effect of changing the queue parameters back and forth. The changes result in a continuous repetition of the four phases (shown right).
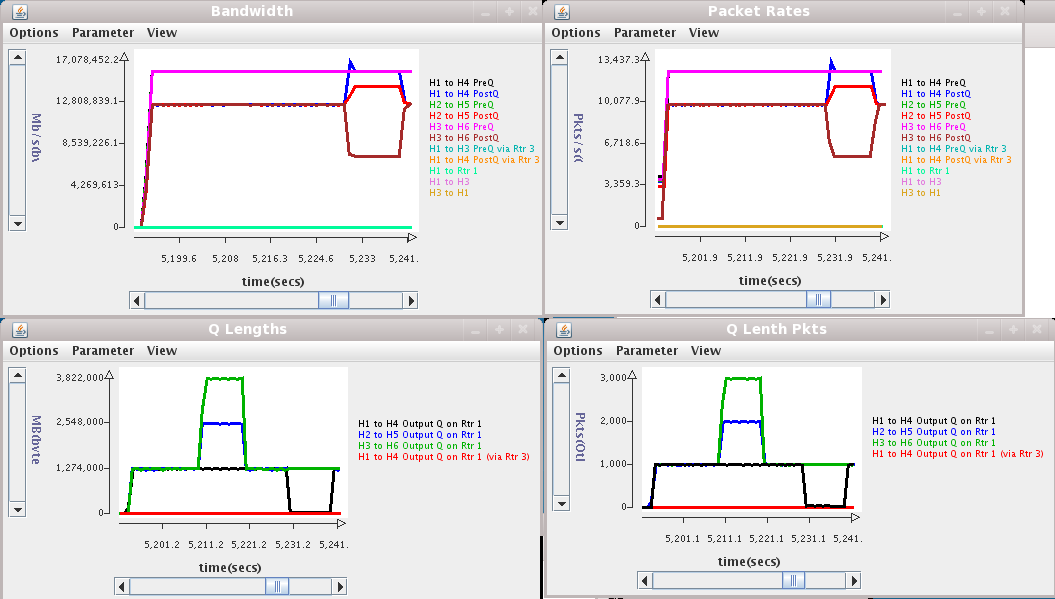
Since each phase lasts 10 seconds, the monitoring charts show changes every 10 seconds with the base case reappearing every 20 seconds; i.e., we see the changes for the sequence (base case, threshold changes, base case, quantum changes) repeated every 40 seconds. In the base case, all three queues (QID 9-11) have a threshold of 1,000 packets and a bandwidth of 100 Mb/s. The four monitoring charts are shown right. Each chart on the right is equivalent to the chart to its immediate left. For example, the two charts on top show bandwidth but the Y-axis on the left chart is in bytes/sec while the one on the right is in packets/sec. Similarly, the bottom two charts are queue length charts with the one on the left showing bytes and the one on the right showing packets. There are two other charts that show equivalent results but where the units of the output rate are bytes/sec instead of packets/sec and the queue length units are in bytes instead of packets. For example, since the packets have a payload of 1,200 bytes, we expect the base case to show maximum queue lengths of 1,200,000 bytes or 1,000 packets for each of the three queues.
In phase 2, the thresholds are changed so that the capacity of queue 9 (H1 to H4) is still
1,000 packets.
But the capacity of queue 10 (H2 to H5) has been doubled to 2,000 packets, and the capacity
of queue 11 (H3 to H6) has been tripled to 3,000 packets.
The queue length chart shows that these changes did occur.
In phase 3, the queue thresholds and bandwidths have been reset back to the base case.
But in phase 4, the queue bandwidths are changed so that the guaranteed bandwidth parameters are now 100 Mb/s, 50 Mb/s and 25 Mb/s. These bandwidths should be viewed as parameters of a max-min fair share allocation; i.e., bandwidth should be allocated in proportion to their ratios 4:2:1 when possible with excess bandwidth redistributed to those with unmet demand. If we ignore the traffic demands (sending rates), the H1 traffic should get about 171 Mb/s (= 300 Mbps x 4/7), H2 should get about 85.5 Mb/s, and H3 should get about 42.8 Mb/s. But since each source is sending at 120 Mb/s, H1 would have an excess of 51 Mbps over the 120 Mb/s it needs. This excess is then divided according to the ratio 2:1 between the other two flows so that the H2 traffic will get 120 Mb/s and the H3 traffic will get 60 Mb/s. Expressing the allocation in MB/s (megabytes per second), we would expect the allocation to be 15 MB/s, 15 MB/s and 7.5 MB/s.
But the bandwidth chart shows the traffic rates out of R1 to be about 16 MB/s, 14.3 MB/s and 7.2 MB/s. The small discrepancies are due to the 78 non-payload bytes (IP header (20 bytes), UDP header (8 bytes), IP/UDP encapsulation (28 bytes) and VLAN-enabled ethernet frame (22 bytes)) that should be included in bandwidth calculations. Detailed calculations that account for this 6.5% overhead will show that H1 traffic at the ethernet level will actually be 127.8 Mb/s instead of 120 Mb/s. That means that H2 and H3 traffic will get a little less bandwidth than first estimated but their bandwdiths will still be in the ratio 2:1.
